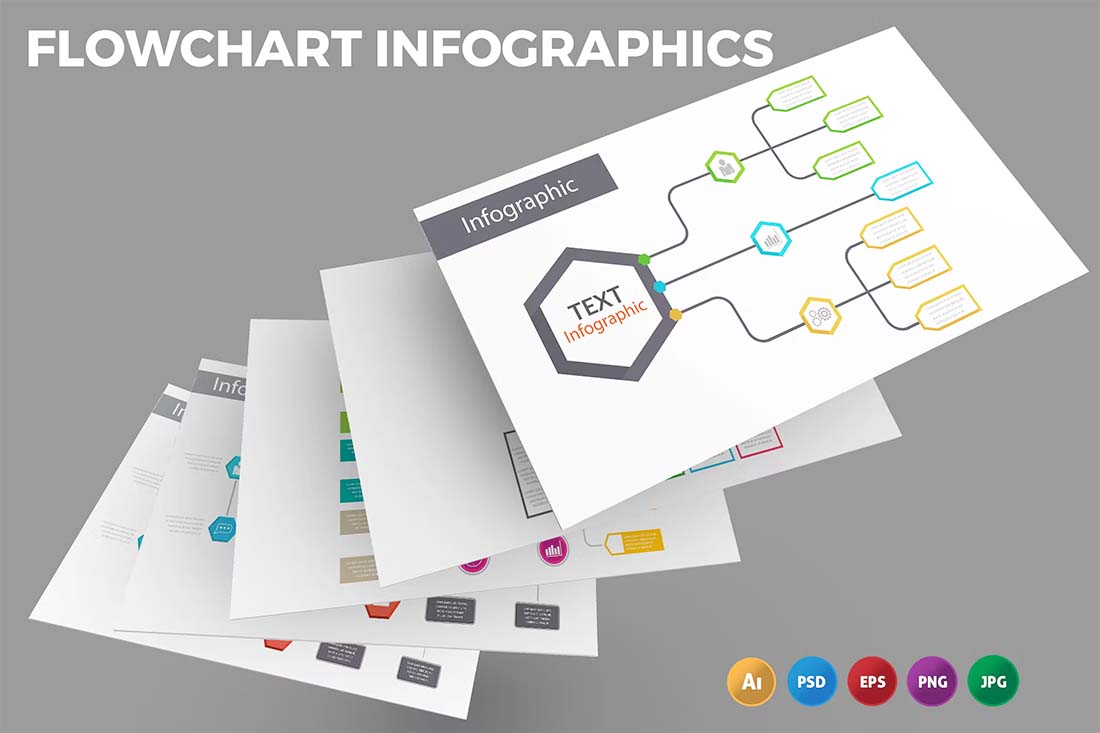
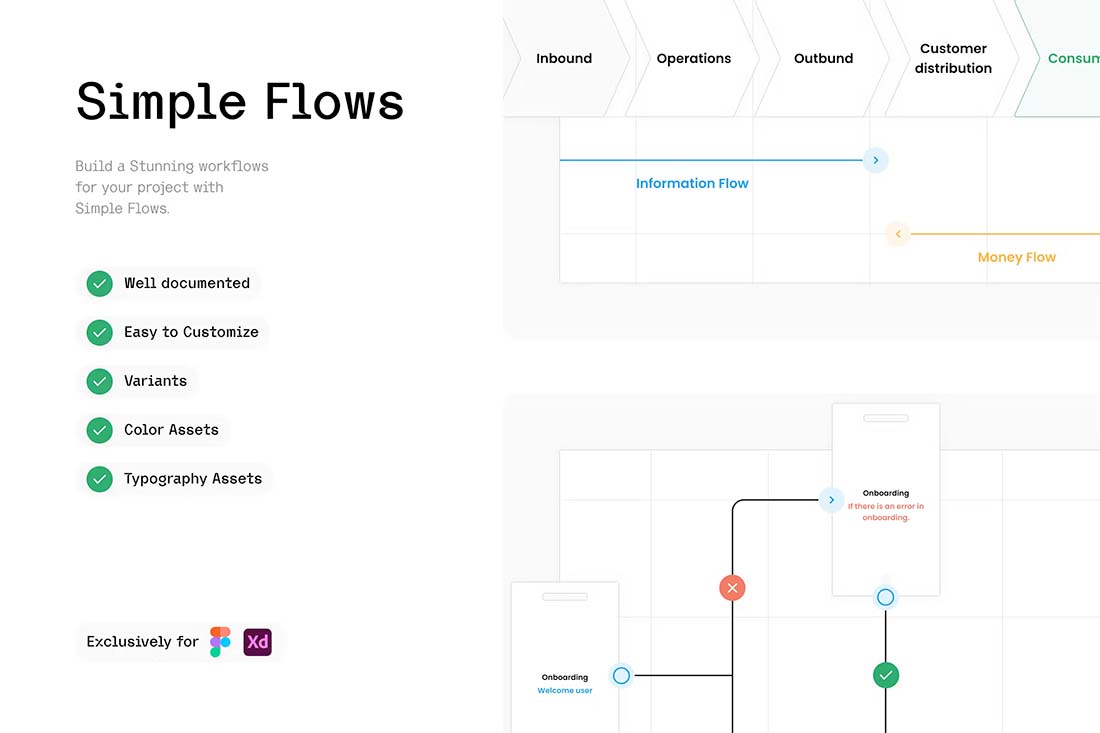
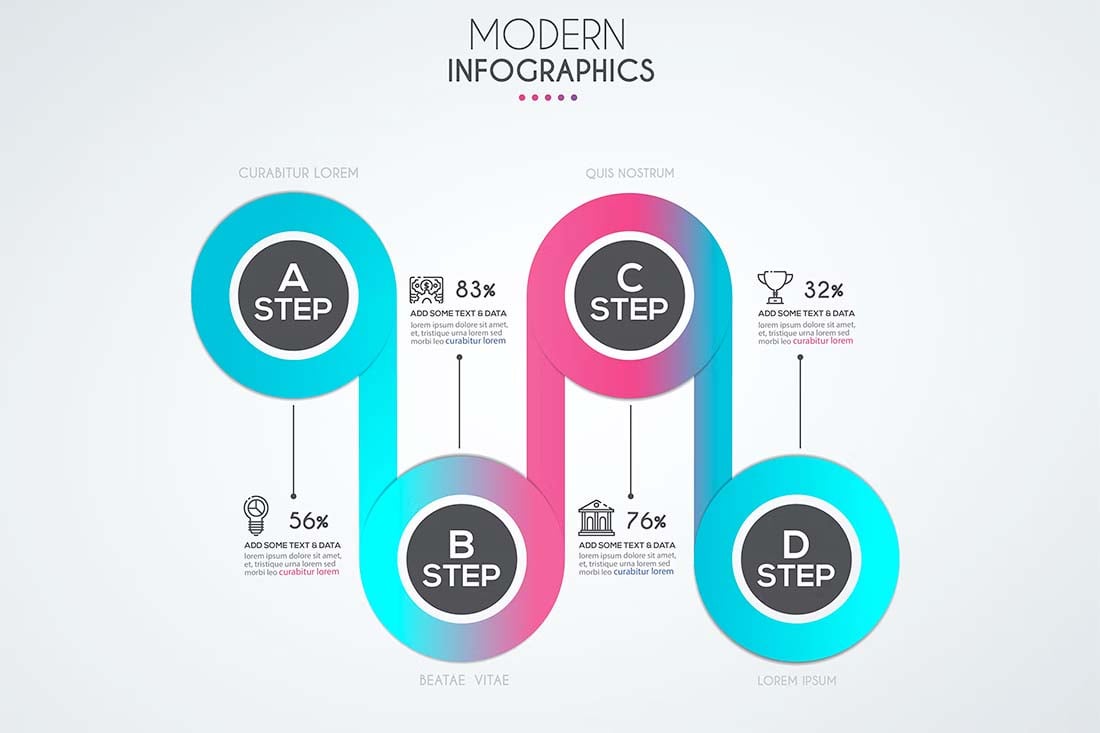
Flow charts have a ton of practical application but aren’t often thought of as a design project. A flow chart can be a beautiful and functional design element.
When it comes to using flow charts, the most common reason is to communicate complex information more visually. You can see processes and how elements in the process or flow relate to one another.
The design ensures that the flow chart communicates this information clearly. But it can be a more complicated task than you might think.
How to Design a Flow Chart
The first step in designing a flow chart is to figure out what you need to communicate. What’s the goal of the chart and what’s the takeaway for people who view it?
The answers to those questions will likely lead you down a path of function and delivery. Are you designing a flow chart that will be static and flat, such as an infographic? Or are you working on a flow chart with more dynamic content that needs to be changed?
From here, you’ll develop an idea of whether you are working with an online, interactive flowchart option or something that you may create and export as a JPG or PDF.
The next step in the design process is to map out what you are trying to communicate. You can almost think of it as an informational wireframe. Sketching is a great way to work on this – use pencil because there will likely be changes – to develop the flow from one element to another.
Every flow chart has a starting point that leads to an endpoint. Begin the design process with these two elements and connect the middle steps.
Most flowcharts use lines and arrows to show movement from one step to another. It’s a best practice to use these standard visual elements in the design to communicate flow.
Think carefully about the microcopy within the flow chart and for labeling. Each element should be easy to understand with clear, concise wording.
10 Flow Chart Design Tips
Many of the design techniques you apply to other projects also apply to flow chart design. Here are a few design tips and considerations to make your flow chart as easy to understand as possible.
- Pick a color and typography palette. If your flow chart is for a brand that already has a style guide, try to stay within those design rules.
- Create and use consistent design elements. This includes shapes, lines, arrows, spacing, and text styles. You don’t need a giant library of elements to create an effective flow chart. Simple design elements are acceptable.
- Information should flow from left to right and top to bottom. Follow common F patterns and reading flow.
- Create obvious markers for beginning and endpoints. Visual starts and stops provide valuable information at a glance and help users start to break down and understand complex elements.
- Use color to code steps and create comprehension throughout the flow chart. You may use more colors in your palette than you are used to or add depth with tints in a monochrome color scheme.
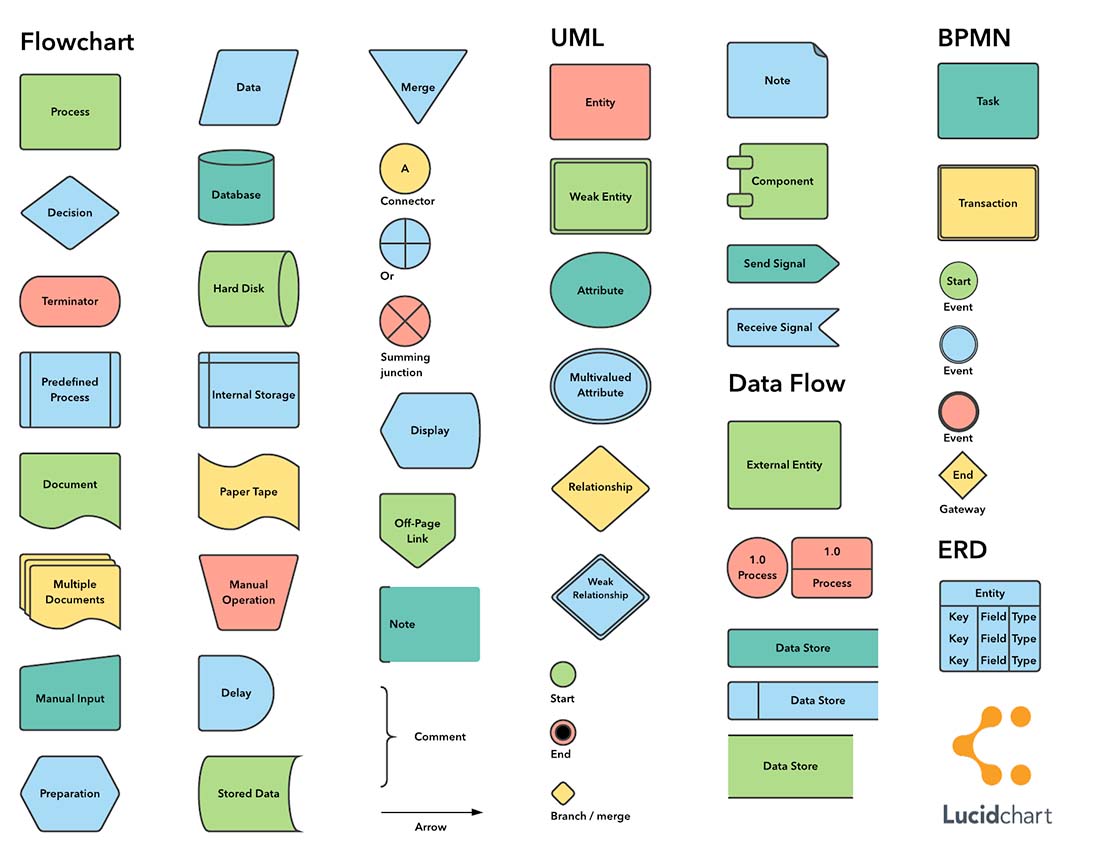
- Use commonly accepted shapes. Lucidchart has a great guide to common flow chart shapes and what they mean (preview above). This might get into more process-oriented design than you need, but can be a good starting point.
- Don’t use more than one typeface in the flowchart. Avoid novelty or fonts that are challenging to read. Keep the text as simple as possible.
- Design clear paths between elements in the chart. Curing or winding lines or directionals are confusing. Every element should have a direct line to the next element in the chart.
- Use labels and supporting text where needed. Keep these elements as tight as possible (ideally 6-10 words).
- Design an appropriate style. Flow charts don’t have to be boring. Match the design to the content matter. Use supporting visuals to create a design that people want to engage with.
Applications for Flow Charts
When does it make sense to design a flow chart? Common applications for flow charts include anything that involved complex information that can be represented visually.
Web designers often use flow charts to communicate sitemaps visually. You can use a flow chart to see how complex navigation may look for a website project.
Graphic designers regularly use flow charts as infographics to share information in a creative way.
While each of these examples is vastly different in form and function, they are common for many designers.
Other types of flow charts include:
- Processes
- Workflows
- Data flows
- Diagrams for how something works
They can be used for all kinds of applications including:
- Project planning
- Audits and processes
- Business models
- To show how something works
- Algorithm mapping
- Decision making
- Data management or flows
- Engineering and supply chains
5 Flow Chart Tools
While you can draw a flow chart from scratch, there are plenty of great tools that can make the task a little less cumbersome and help you create visual consistency.
- Envato Elements: Templates and starter kits with all types of design elements in a variety of file formats including vector options
- Lucidchart: Collaborative online diagramming and flow chart tool. Strong templates make it easy to use right away.
- Draw.io: Open-source chart making tool that integrates with common tools, such as Google Drive, GitHub, and Dropbox.
- Cacoo: Team diagramming tool that works for everything from flow charts to wireframes with a clean and simple interface.
- EdrawMax: The all-purpose diagramming tool makes it easy to create traditional flowcharts or more complex charts such as wiring diagrams.
Conclusion
Now that you are thinking about flow chart design, it’s time to get started. All of the design templates featured here are available for download from Envato Elements. You can also use some of the digital tools noted above for online flow chart creation.
The type of chart and tool you design to use directly correlates to that very first question: What’s the goal of the chart? From there, you’ll make choices about the flow chart function and design.


0 Commentaires